How do you stand out amidst the massive OTT competition while encountering widespread subscription fatigue? If you’re like most streamers, you’ll agree the best way to differentiate is by innovating through content, user experience, and device support. How successful you are with this depends on your ability to measure how effective your strategies are and iterate dynamically for success.
Where's the challenge?
Most broadcasters find it challenging to obtain the specific real-time data insights needed for efficient growth. This difficulty often stems from the inflexibility of their subscriber analytics solutions. Even if your solution effectively compiles data from millions of subscribers across multiple channels and devices, it typically presents this information in generic dashboards. As a result, there's no quick or easy way to provide different teams with the dynamic answers they need to meet their objectives.
Result: Growth attempts slow down while different teams get caught in the whirlwind of complex and time-consuming data analysis. Relatable?
In our constant spirit to help broadcasters future-proof streaming, we’ve devised an actionable solution to this problem. In this blog, we spotlight our all-new report personalization tool, ChurnIQ Studio.
Read on to find out what makes this addition to our existing intelligent and predictive churn analytics solution, ChurnIQ, a game-changing development for growing your D2C subscriber business.
Introducing ChurnIQ Studio - Your personalized data dashboard
ChurnIQ Studio is a unique analytics personalization tool built on ChurnIQ, designed to provide your teams with unmatched data flexibility. It enables them to quickly track what truly matters and streamline their data-driven decision-making process. Teams can create personalized, easy-to-use analytics dashboards and visualizations and share them effortlessly.
Here’s how ChurnIQ Studio makes it easy to answer the questions you really care about
1) It works for your unique needs
ChurnIQ Studio lets different teams tailor analytics beyond the templated dashboards to their unique needs. Using its filters, different teams can:
- Create unique dashboards based on team or role
- Build custom KPIs depending on the strategic requirements
- Explore 80+ data dimensions without any limitations
- Visualize any metrics and add forecasts and targets
In short, it helps ensure unique business metrics are always at your fingertips. You can use them to optimize your campaigns and respond to the changing market needs. Result - you get to ensure your efforts resonate with your audience across the board.
Example: A team can use ChurnIQ Studio to create custom calculations, such as the cumulative sum of revenue for a selected customer (that isn't available in a generic dashboard). While they calculate this, they can also toggle the view to see the data, visualization, and filters in one place. With that, they can leverage any dimension to create a new, custom KPI.
For example, one can create a “Revenue per Coupon” indicator to measure the performance of a marketing campaign and identify which coupon outperforms the others and should be used the most frequently.
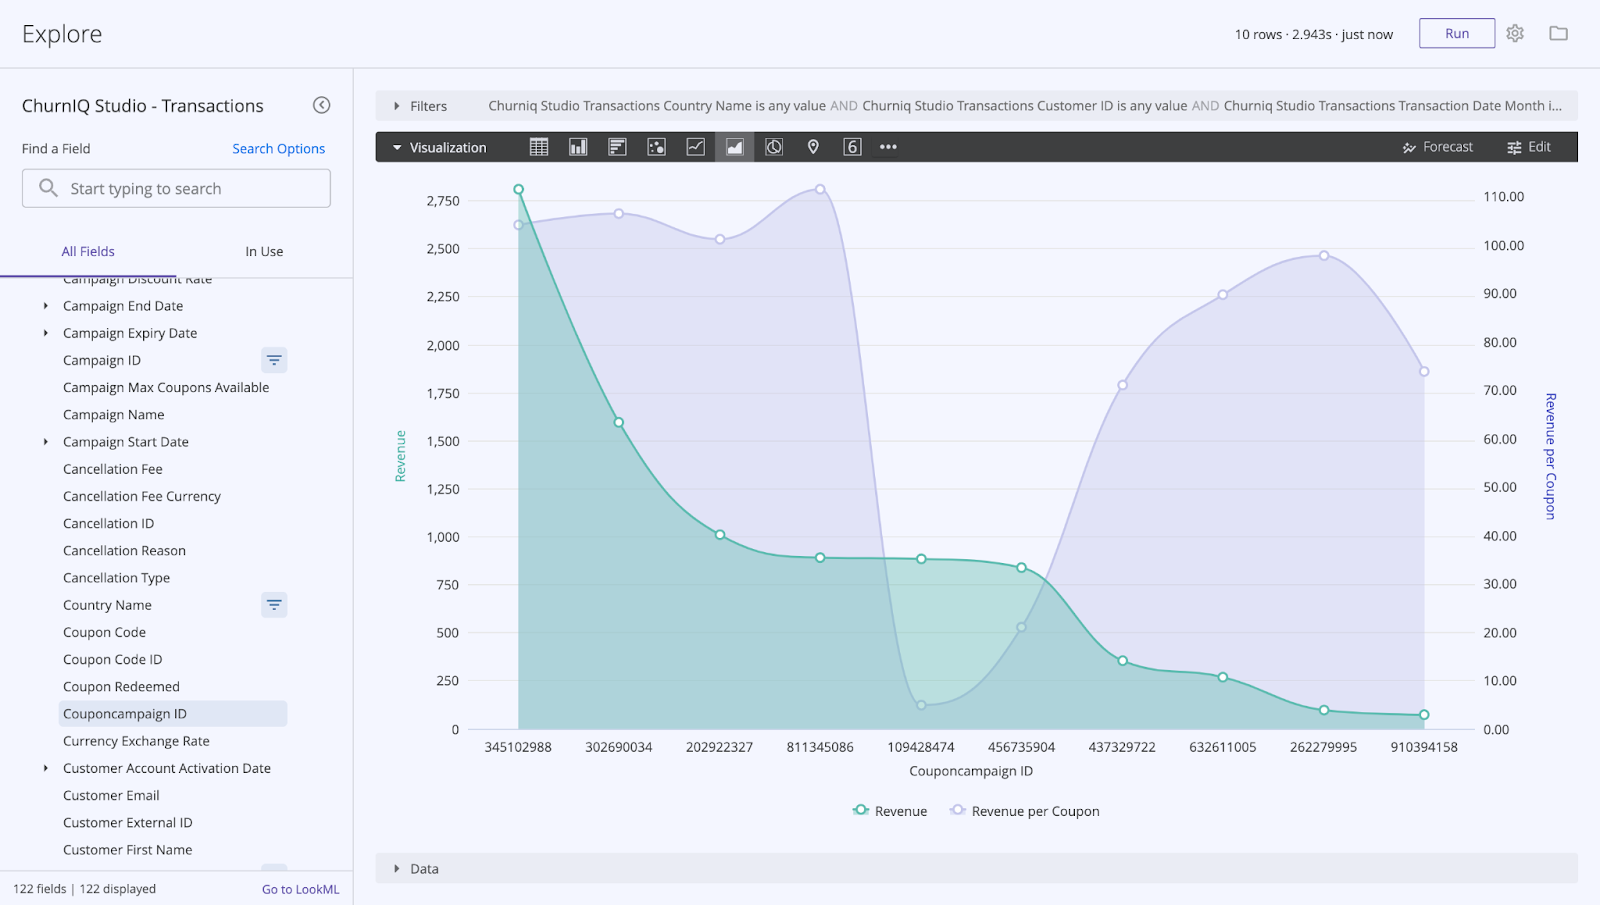
As you can see from the graph above, it accounts for both Revenue and Revenue per Coupon. This shows how some coupons give high Revenue per Coupon yet low total Revenue. For this team, the perfect case scenario would be exploring both high Revenue and high Revenue per Coupon. In this case, it’s coupon “345102988.”
2) Lends you scientific decision-making abilities
ChurnIQ Studio offers unparalleled access to user data segmentation that anyone can use. It enables team members to easily track subscriber behavior, from purchase patterns and upsell performance to retention improvements. They can group viewers by specific attributes and create custom cohorts to evaluate the effectiveness of their strategies, empowering them to make impactful decisions.
For example, a team could use their personalized dashboard to quickly identify the most valuable churned customers, further breaking down this data by age group, location, and subscription tier. If they discover that young adults in metropolitan areas are most likely to subscribe to premium annual plans, they can adjust their promotions to focus more on annual subscriptions in those regions.
3) It's easy-to-use without prior technical expertise
ChurnIQ Studio’s interface is highly intuitive. Different marketing and product team members who may not even have any advanced technical skills or specialized knowledge can use it easily by themselves. The documentation and tutorials are best-in-class to ensure everything is clear in case of difficulties.
Example: Drag-and-drop features to create custom charts
Highlight: ChurnIQ Studio is on its way to integrating with a GenAI solution. This upcoming feature, AIssistant, will enable you to generate instant insights using AI to facilitate decision-making.
Want to see how it works?