After launching new features of the advanced dashboard couple of months ago, we were testing and learning how our Publishers use the data to provide them with improved analytics for your Video-on-demand & Live streaming pay-per-view.
From these observations we drew a strong conclusion that our top priority was to enable faster access to crucial business data. Not compromising the full depth of the advanced dashboard - we made it more visual. The routinely collected enormous amounts of information is now turned into pictures and graphs, month by month.
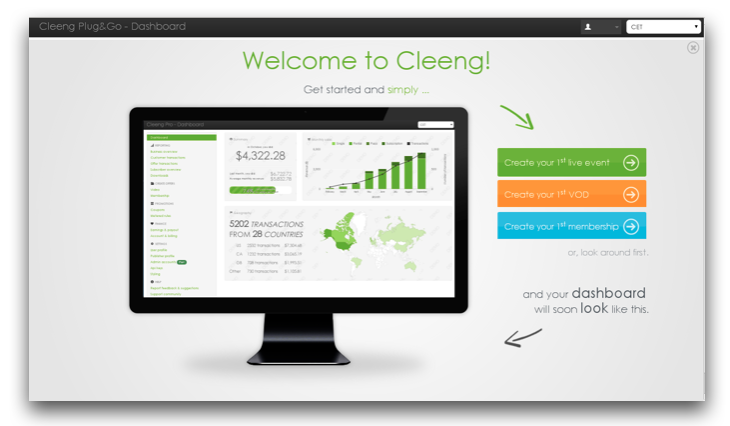
The new dashboard gives you a quick glance at what’s happening within your sales. You can log into your dashboard every day to simply check how your sales is doing. If you need more advanced data, you can easily dip into details of any of the existing transactions. The menu (on the left) contains all the sections you're already familiar with, like: customer transactions, offer transactions, subscribers overview and so on.
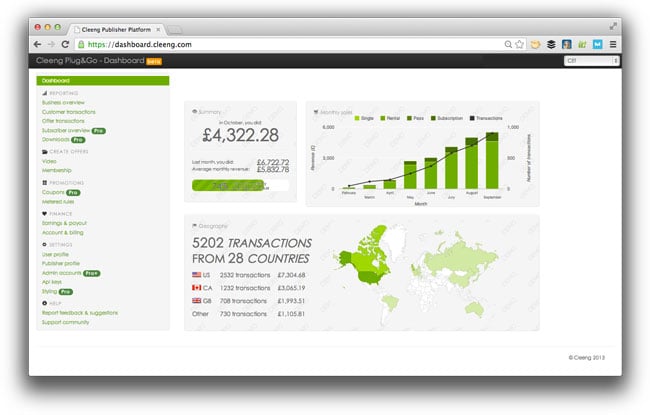
With the new feature you can check in one glance:
√ how much you earned last month and how it relates to the previous months;
√ number of transactions in the last 4 weeks;
√ number of customers we lay against a map - now you can see which countries your customers are coming from.
I’m thrilled to share this new feature with you today. Leave a comment below and let me know how you like it so far.
Haven't try out Cleeng yet? I invite you to register a free account to see how easy it is to set up a video-on-demand paywall and Live streaming pay-per-view events.
-Monika, Cleeng Community Manager