It’s no secret that sustainable growth comes from customer retention.
In fact, with marketing channels being increasingly saturated and customers becoming ever more tired of the non-stop flow of new subscription offers - retaining customers separates winners from losers in the SVOD industry.
To paraphrase the wise and great Mufasa, customer retention —or, in our case, subscriber retention— covers “everything the light touches.” And so we thought you’d like a shortlist of what matters to track to base strategic decisions on key SVOD retention metrics to nail subscriber retention.
Click to jump to the section:
Customer retention metrics for OTT teams
- Churn Rate
- Subscription growth rate
- Average Subscriber Lifecycle
- User retention cohort analysis
Engagement and product usage metrics for OTT teams
- Client usage models
- Monthly recurring revenue (MRR)
- Annual recurring revenue (ARR)
- Average revenue per user (ARPU)
- Customer Lifetime Value
Customer support metrics for OTT teams
- Average time to resolve (streaming) issues
- Response Rate on Support Channels
- Net Promoter Score (NPS)
- Customer Satisfaction Score (CSAT)
Customer retention metrics for OTT teams
Churn Rate
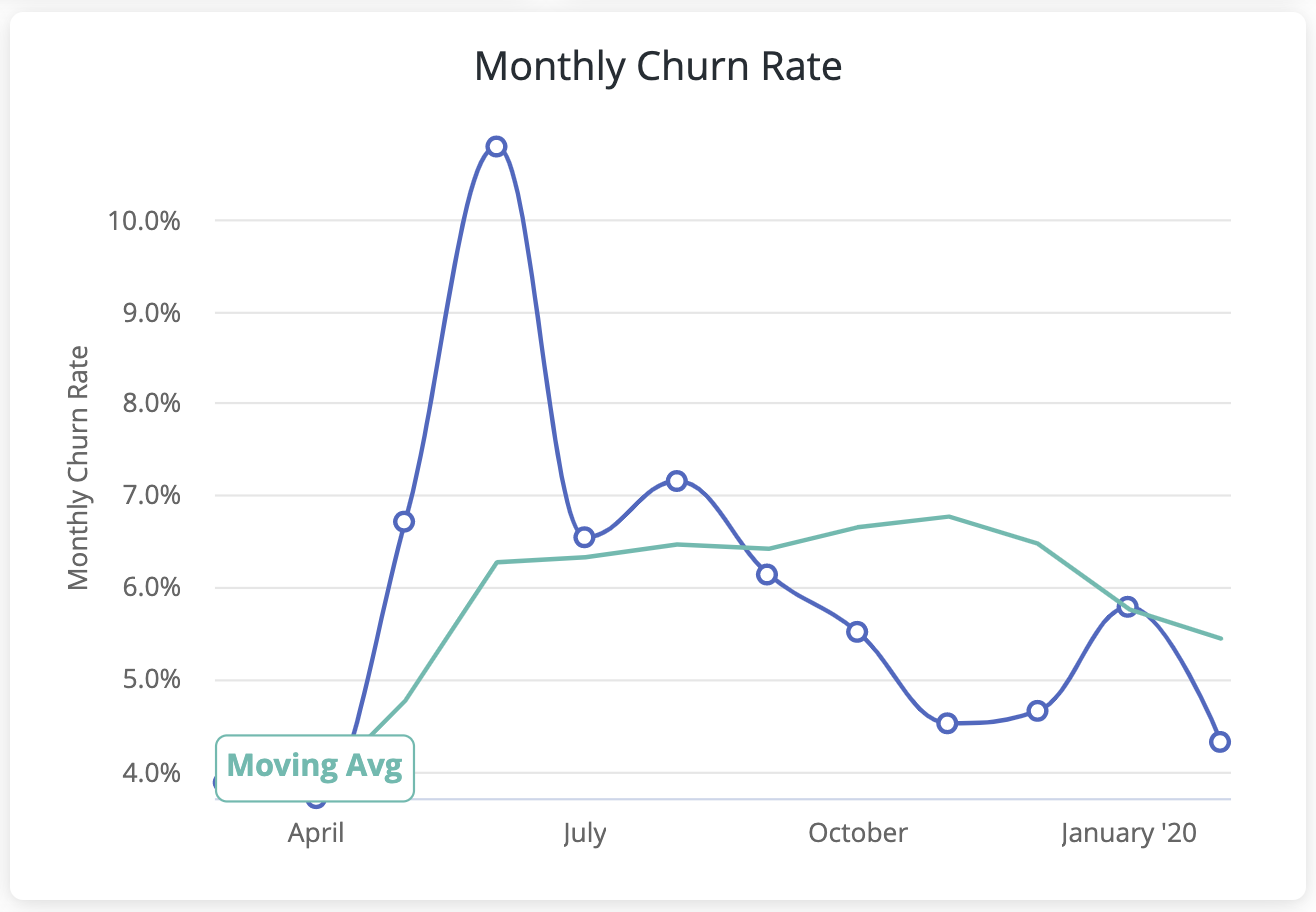
The OTT churn rate refers to the percentage of customers who cancel their OTT subscription within a given time period. The lower, the better.
Dropping your churn rate by a single point must become a cause for celebration.
- A one-point drop in your monthly churn rate will transform your revenue performance.
- A one-point increase will, in turn, increase your ARR revenue by 12-13%. You’d need to grow your monthly acquisition rate by at least 5% to match that outcome.
This is why your subscriber churn rate should be the best-known number in your team.
Some managers make this happen by setting up weekly alerts that trigger messages to update their team about the current churn rate. Others take it further and permanently display their churn rate on an office monitor.
Whichever way you do it, making your churn rate a focal point for everyone who can impact it is the key to moving it in a positive direction.
How to calculate your OTT churn rate
To measure your customer (or subscriber) churn rate, you need two indicators (we added dummy figures to feed our examples.
- Number of lost customers during a specific period (L): 1000
- Total number of customers at the start of the period (S): 8000
Here’s the formula to calculate your churn rate:
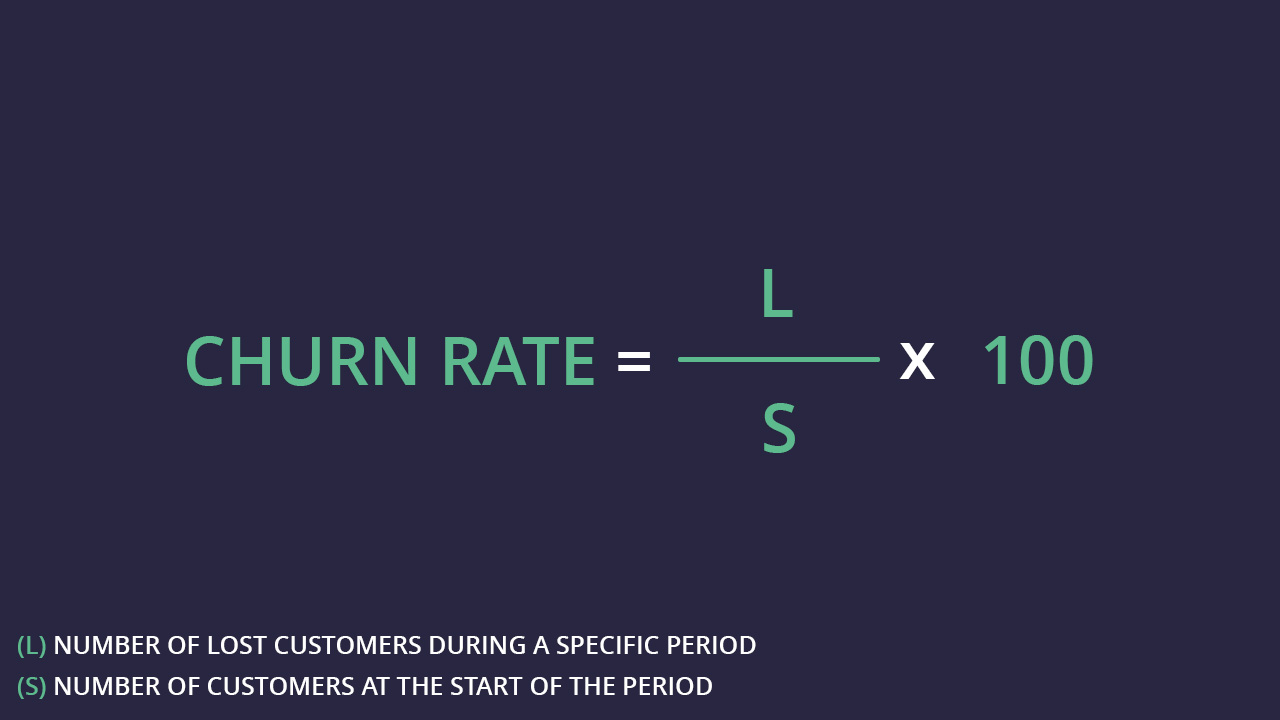
- Churn rate = (L) / (S) x 100
- Churn rate = (1000 / 8000) x 100
- Churn rate = 12,5
In our example, our churn rate is 12,5%
Subscription growth rate
The subscription growth rate measures the rate at which the subscriber base is growing.
A high growth rate indicates positive subscriber retention as more customers join and stay with your OTT service.
How to measure your subscription growth rate
To measure your subscription growth rate, you need two indicators:
- Number of subscribers at the start of the period: 10,000 (S)
- Number of subscribers at the end of the period: 15,000 (E)
Here’s the formula to calculate your subscriber growth rate:
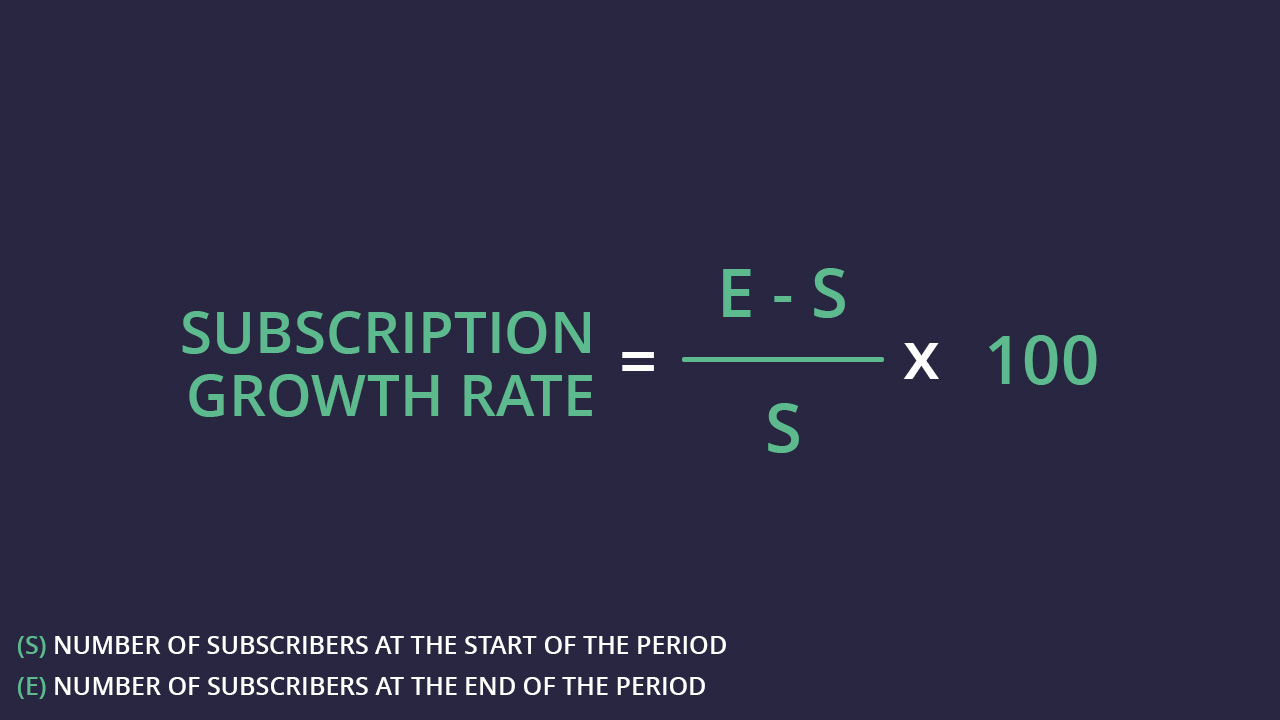
- Subscriber Growth Rate = ((E - S) / S) x 100
- Subscriber growth rate = ((15,000 - 10,000) / 10,000) x 100
- Subscriber growth rate = 50
In our example, our subscriber growth rate is 50%.
Average Subscriber Lifecycle
The average subscriber lifecycle refers to the average length of a subscription at a given moment in time.
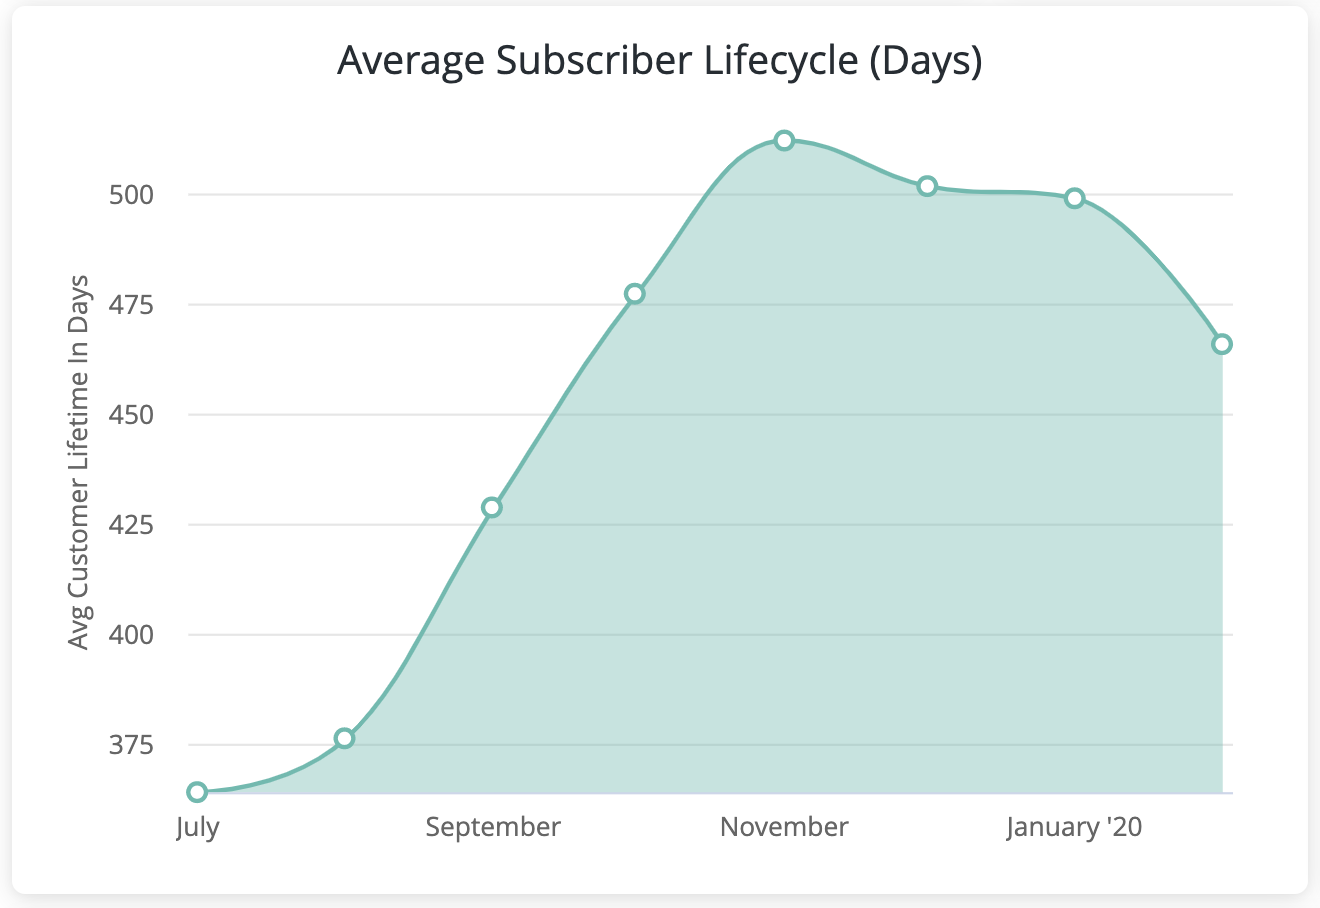
- Do you know what your average customer lifespan is?
- Does this vary across plans? Or seasons?
- How many of your current subscribers are in the cycle's early, middle, or late stages?
You need to know the answer to the above to create a failproof customer retention strategy.
One thing that we observe with our customers is that a team that understands their business’ unique subscriber lifecycle dynamics has a serious edge in building effective retention strategies, for two reasons:
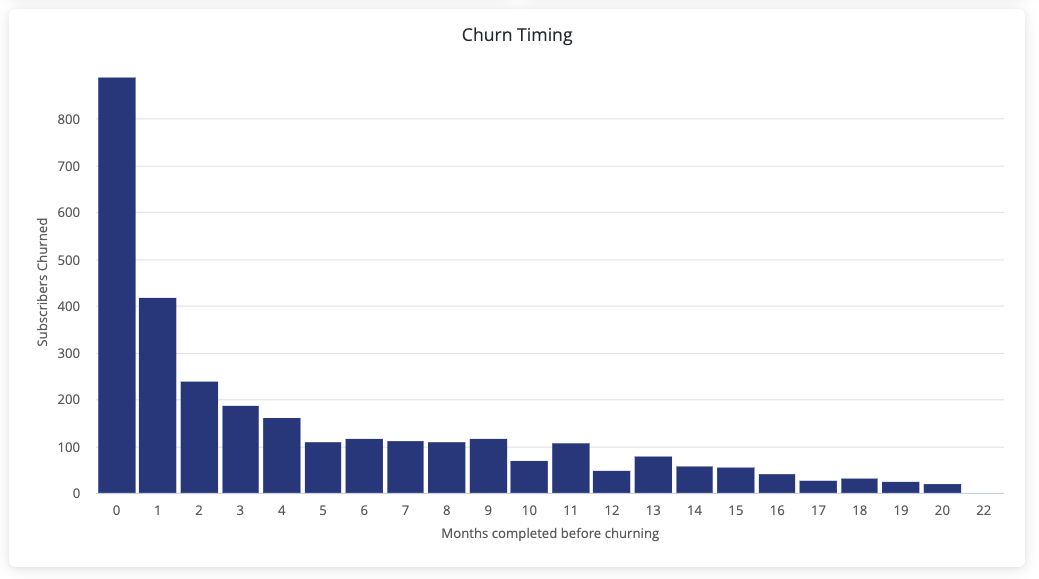
1. Know when to expect churn (and prevent it)
Our churn timing learning models repeatedly find that the lifecycle point of a customer is one of the biggest factors in determining when they churn.
For instance, your service has finite content and functionality to discover. Customers often lose interest when this discovery period ends, causing churn to spike at the corresponding point in the lifecycle.
You can fix this problem by showing subscribers hidden gems from your catalog and letting them know what’s coming to offset this slump in interest.
But to fix the problem, you first need to see it.
This is where churn timing insights are essential.
Another powerful dimension of the subscriber lifecycle KPI is lifecycle segmentation.
2. Segment communications based on who subscribers are
Sending the right message to the right audience at the right time. You’ve heard this a thousand times. And it’s likely because it’s always a challenge.
The importance of this balance in customer retention performance cannot be overstated.
In application, it means you need to be able to differentiate a subscriber who has been with you for two weeks from another who’s been subscribed for over ten months.
Is it something you can do? Learn how to increase retention with OTT segments.
User retention cohort analysis
A cohort analysis gives you a visual representation of your average customer lifecycle.
It helps OTT teams segment users based on their start date and, therefore, understand what events in time trigger the main customer acquisition and churn spikes.
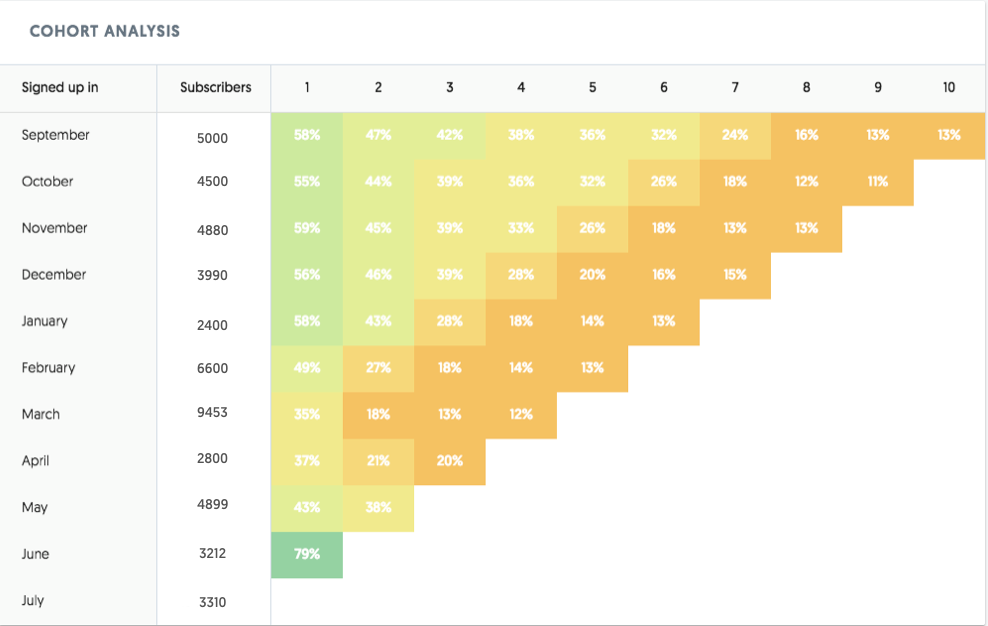
This analysis breaks down subscriber retention by cohorts (e.g., customers who joined in a particular month). It helps identify if retention rates are improving or declining over time, allowing for targeted improvements in retention strategies.
Engagement and product usage metrics for OTT teams
Understanding subscriber behavior through data analysis, such as user journey mapping, can reveal patterns that indicate retention drivers or barriers.
For example, identifying specific content preferences or viewing habits can help personalize the subscriber experience and increase retention.
Engagement data can be misleading if…
…you don’t read between the lines.
Let’s take an example:
We explore churn dynamics and, in particular, usage before cancellation (or ‘pre-churn engagement’ as we call it at Cleeng).
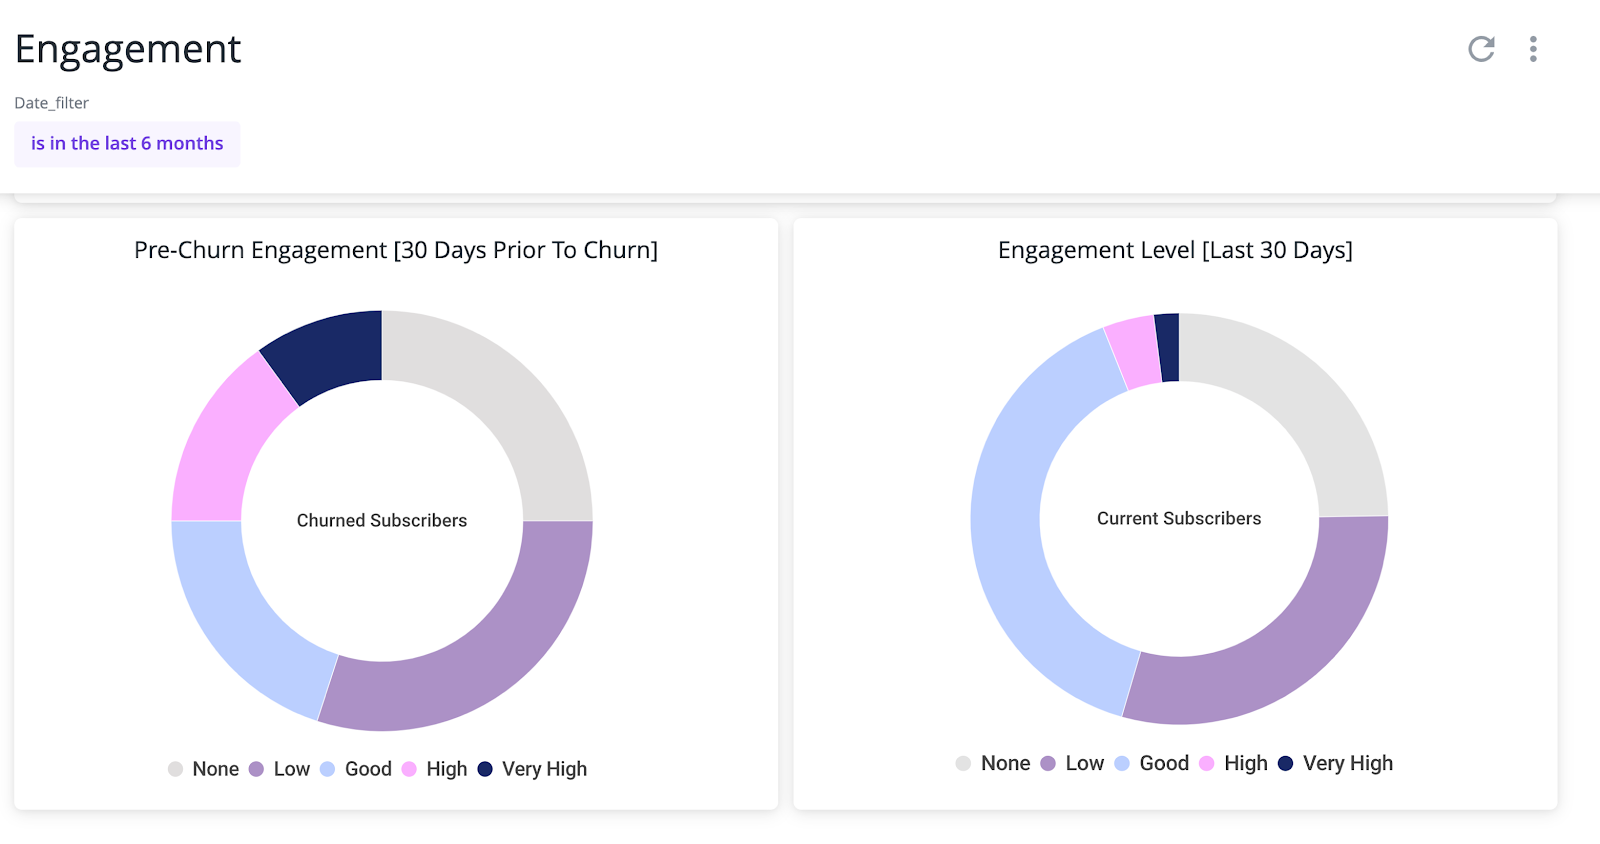
Looking at pre-churn engagement data, highly engaged users are massively over-represented.
In other words, an important part of the churned users are also among the heaviest users of the service in the past 30 days.
How is this possible?
Moving from engagement to cancellation analytics, we find that the number of churned highly engaged subscribers corresponded to another group in the cancellation analysis: “Not enough relevant video content.”
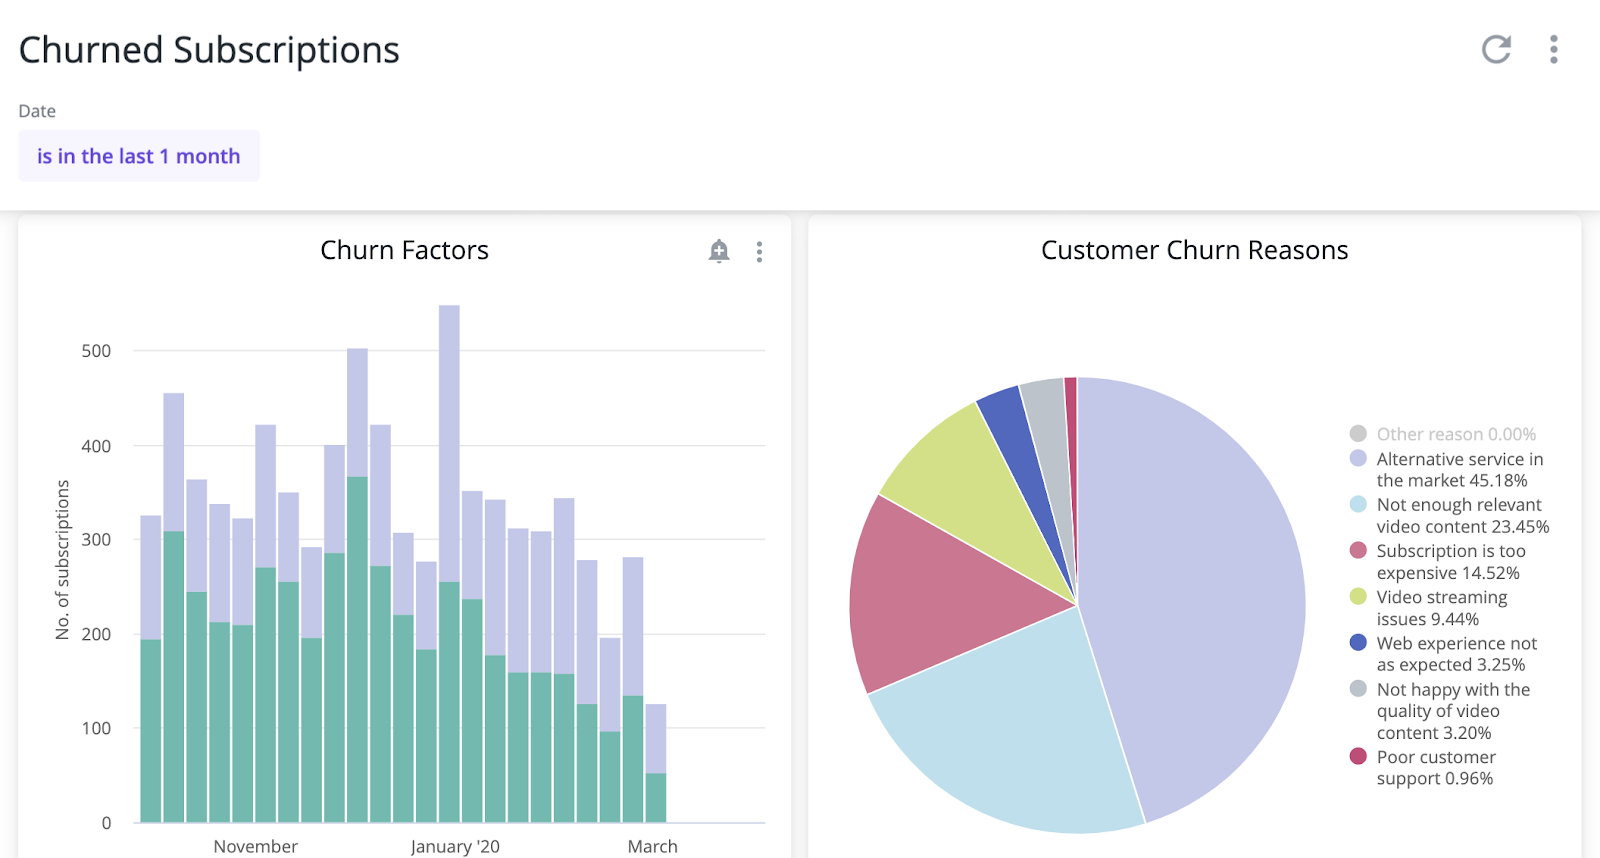
The service had so perfectly appealed to this segment that its customers were burning through the content too fast for them to keep up.
And, of course, when subscribers have nothing else to consume, you can expect them to churn.
So, how do you use this information to improve your retention rates?
Client usage models
We like to pay close attention to our clients’ usage models.
The logic of a usage model goes like this: what percentage of your overall subscriber base engages daily, weekly, and monthly?
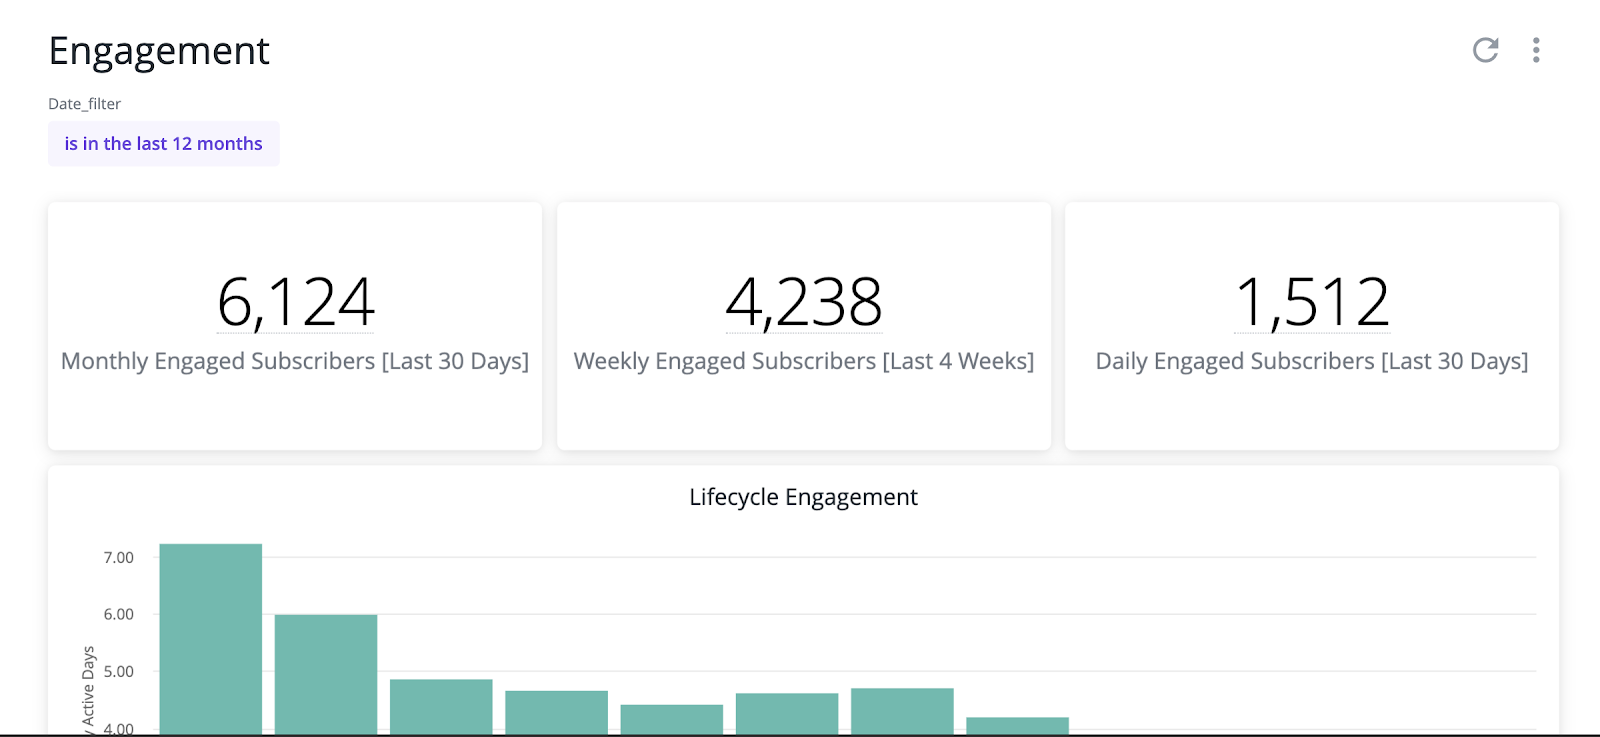
In the above example, let’s assume this service has 10,000 subscribers. This means their usage model is roughly:
- 61% monthly,
- 42% weekly,
- 15% daily.
This model helps identify what ‘normal’ engagement is for your service. By keeping an eye on those, you’ll be able to notice spikes in engagement and, therefore, anticipate potential bingers about to churn and send targeted messages to invite flagged users to discover more items from your content library.
Revenue metrics for OTT teams
Monthly recurring revenue (MRR)
MRR tracks the total revenue generated from recurring monthly subscriptions. By monitoring changes in MRR, OTT providers can gauge the health of their retention efforts.
Note that Monthly Recurring Revenue excludes any one-time or non-recurring revenue streams, such as one-time purchases or additional services. MRR specifically focuses on the predictable, ongoing revenue generated by customer subscriptions.
By monitoring MRR, subscription companies can:
- Identify trends,
- Track changes in revenue over time,
- Measure customer retention,
- Evaluate the impact of pricing changes
- The number of new customers joining.
In short, analyzing MRR allows businesses to make informed decisions on scaling operations, improving customer retention, optimizing pricing strategies, and overall business growth.
How to calculate your MRR
To calculate MRR, you need to sum up the subscription fees from all of your active customers during a specific month.
For better insight, you can also break it down into different segments, such as different subscription tiers or plans.
Annual recurring revenue (ARR)
ARR, or Annual Recurring Revenue, is a metric used by subscription-based companies to calculate the total annualized revenue they expect to generate from their customer subscriptions.
Unlike MRR, which measures monthly revenue, ARR provides a comprehensive view of revenue over a 12-month period.
ARR offers several benefits for subscription businesses.
- It provides a clear overview of the company's revenue stream potential over a longer period, allowing for more accurate planning and forecasting.
- It enables businesses to assess their sustainability, evaluate the success of their subscription-based model,
- And attract potential investors or stakeholders by demonstrating predictable and stable revenue streams.
How to calculate your ARR
To calculate ARR, you need to add your MRR for the previous 12 months.
Average revenue per user (ARPU)
ARPU calculates the average revenue generated per subscriber over a specific period of time.
By tracking changes in ARPU, OTT providers can identify if their retention strategies effectively drive revenue growth.
ARPU is a valuable metric because it allows companies to:
- Evaluate pricing strategy: ARPU helps determine whether your pricing model effectively extracts maximum value from your existing customers. By monitoring changes in ARPU, businesses can assess the impact of price adjustments on revenue generation and profitability.
- Assess your growth potential: ARPU provides insights into your revenue growth potential. If ARPU increases over time, it also suggests that user engagement is increasing and/or that your upselling strategy is working.
- Compare performance per segment: ARPU can be used to evaluate and compare your subscriber segments’ performance. It can help identify which segments drive higher revenue and, therefore, give you a chance to grow revenue from specific customer groups.
Note that key metrics such as customer acquisition costs (CAC), churn rate, or lifetime value should be considered alongside ARPU for a more holistic view of the business's revenue generation and profitability.
How to calculate ARPU
To calculate ARPU, you need to divide the total revenue generated within a given period by the total number of subscribers during that same period.
Customer Lifetime Value
Customer lifetime value (CLV), or subscriber lifetime value (SLV), refers to the total revenue subscribers generate over their entire relationship with the OTT service.
This essential subscriber retention metric helps determine profitability and can guide customer acquisition and retention strategies.

How to calculate your customers’ lifetime value
To get to the most accurate number, you need to follow this equation:
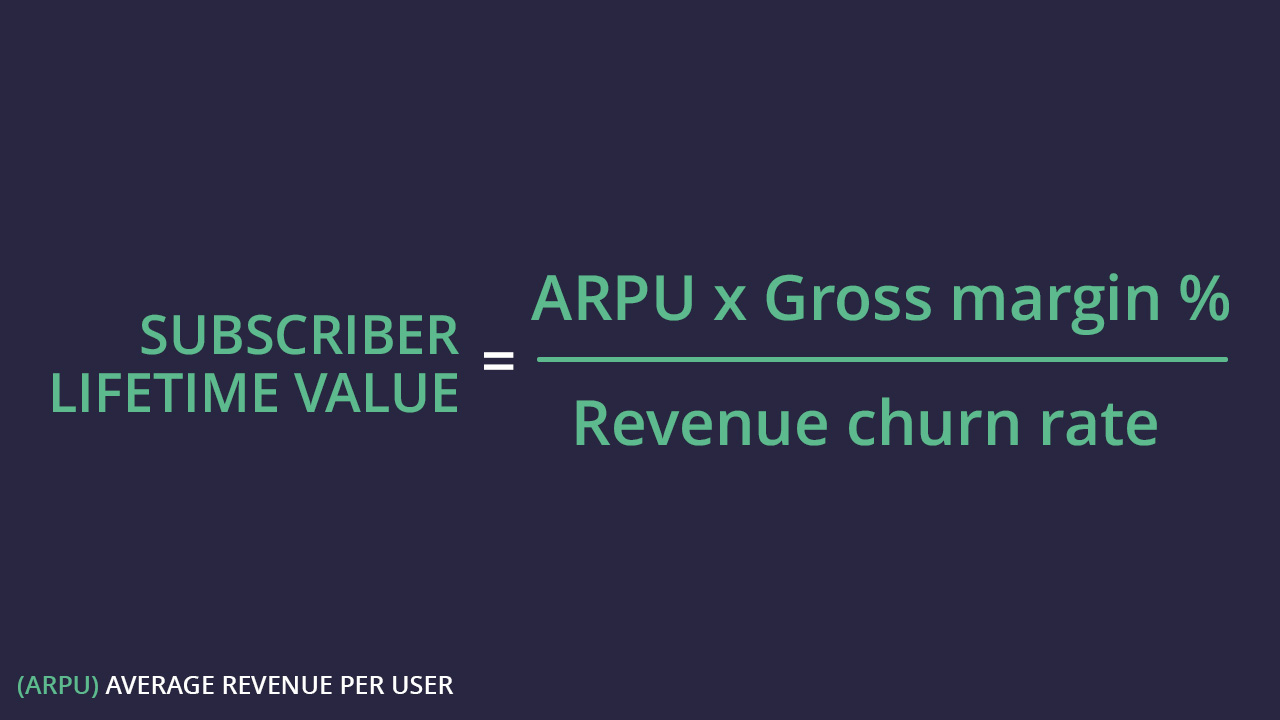
LTV = ARPU * Gross margin (%) / customer churn rate
Customer support metrics for OTT teams
Customer support metrics play a crucial role in assessing customer satisfaction, optimizing operations, and ensuring a positive user experience.
Tracking metrics related to customer support, such as response time, issue resolution rate, or customer satisfaction with support interactions, can indicate how well the OTT provider is addressing and resolving customer concerns or problems, ultimately impacting retention.
Average time to resolve (streaming) issues
This metric measures the average time it takes to resolve customer issues related to streaming problems, video playback errors, or platform glitches.
The lower, the better.
A lower average time to resolve indicates faster issue resolution, reducing customer frustration and improving user experience.
Response Rate on Support Channels
The response rate evaluates the percentage of customer inquiries or issues that receive a response within a defined time frame.
A high response rate ensures timely assistance and enhances customer satisfaction.
Net Promoter Score (NPS)
NPS measures customer loyalty and their likelihood to recommend your OTT products or services to others.
It provides insights into overall customer satisfaction and helps identify areas for improvement in the customer experience.
Customer Satisfaction Score (CSAT)
CSAT measures customer satisfaction with specific interactions or experiences.
You can use CSAT surveys after specific customer interactions, such as support tickets or account management, to gauge satisfaction levels. Customers rate their satisfaction on a scale (typically 1-5 or 1-10), with higher scores indicating greater satisfaction.
You could create subscriber segments linked to NPS and CSAT scores to give unhappy customers special treatment and turn the boat around.
Track what matters. Build your OTT empire.
You now have a comprehensive list of key indicators to track and combine to get the full picture behind your retention performance.
The above information is something you could get and act on with Cleeng’s advanced analytics and solutions. Alternatively, you can also contact our experts to learn more.